LTA's Efficiency Stats
Lighter-than-Air technology (LTA) will prove itself the most efficient and profitable form of transportation in the 21st century, beating out all other modes in time and fuel economy and by providing a unique passenger experience.
Efficiency: LTA vs. Contemporary Transportation
In general, there are at least 7 common factors that can be used when comparing today’s transportation technologies:
- Ownership Cost
- Maintenance Cost
- Operating Cost
- Infrastructure Cost
- Fuel Efficiency
- Time Efficiency
The chart below is an overall efficiency comparison between Lighter-than-Air technology, also known as LTA, and 4 of today’s most common modes of transportation.
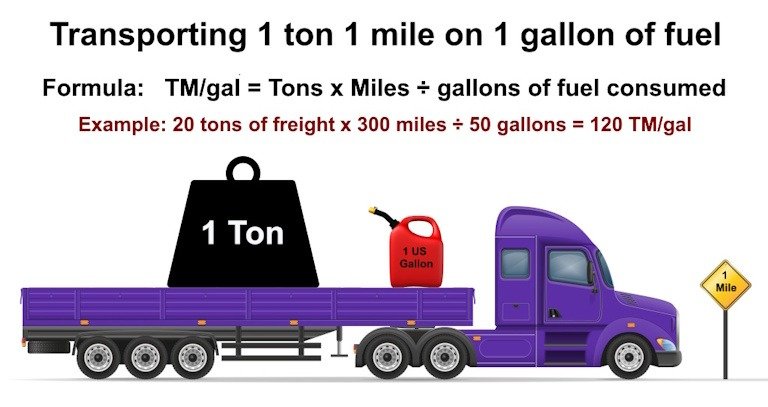
The metric used to measure overall efficiency within the cargo industry is the “ton-mile per gallon” (TM/gal). It indicates the cargo in tons that can be transported 1 mile on 1 gallon of fuel. The higher the number, the greater the fuel efficiency.
It incorporates 3 factors:
- Load capacity
- Distance traveled
- Fuel efficiency
Ton-Mile per Gallon Explained
Speed can also be used to calculate ton-miles per gallon.
As an example:
- Speed: 60 mph
- Distance: 300
- Load: 20 tons
- Fuel consumption: 10 gallons per hour
Calculating duration of travel:
- 300 miles ÷ 60 mph = 5 hours
Calculating fuel consumption:
- 5 hours × 10 gallons per hour = 50 gallons of fuel total
Calculating ton-miles per gallon:
- 20 tons × 300 miles ÷ 50 gallons = 120 TM/gal
It’s important to realize that a faster speed does not always equate to a better TM/gal rating because it often is not enough to compensate for the greater fuel consumption by the vehicle.
Slower vehicles with better fuel efficiency often have greater TM/gal ratings versus faster vehicles with less fuel efficiency.
Transport by fixed-wing aircraft will always be the least fuel efficient. As an example, a Boeing 757-200, one of the most popular aircraft for airfreight operations, can carry 35 tons of freight at a cruising speed of approximately 500 mph but consumes 1,500 gallons of fuel per flight hour.
Calculating the 757-200’s TM/gal rating:
- 35 tons × 500 miles ÷ 1,500 gallons of fuel per hour = 12 TM/gal
The trucking industry’s documented national average is 72 TM/gal.
The ton-mile per gallon rating of 673 for shipping by vessel is based on the OOCL Hong Kong, one of the world’s largest and most fuel-efficient container ships. There are over 5,000 registered container ships worldwide, many of which are smaller and less fuel efficient.
The overall TM/gal rating for shipping by vessel is much less than indicated because it depends on trucking, a less efficient mode, to pick up and deliver the freight it’s transporting.
Rail is often touted as the most fuel-efficient form of ground transportation. But rail access is limited and, like shipping by vessel, is reliant on trucking for the first and last mile of the delivery process, reducing its overall ton-mile per gallon rating below what is indicated.
Our TM/gal ratings for rail are based on the SD90MAC, one of North America’s most popular locomotives.
In the chart above, there are 3 columns that represent rail’s fuel efficiency:
- Rail-1 represents the TM/gal rating for ideal conditions: 0% grade with no wind, precipitation, or curves in the track.
- Rail-2 represents the same conditions, but the grade is increased to 1%.
- Rail-3 also has the same conditions, but with a 2% grade.
A 1% grade represents a rise of only 1 foot over a 100-foot length of track, with a 2% grade being a rise of 2 feet over the same length of track.
The steepest railroad grade in North America is nearly 6% with road grades far exceeding this amount!
The noticeable difference between Rail-2 and 3 versus Rail-1 demonstrates how significantly gravity can affect fuel economy.
Compounding this issue is the reality that grades are virtually everywhere.
In the chart, there are also 3 columns that represent LTA:
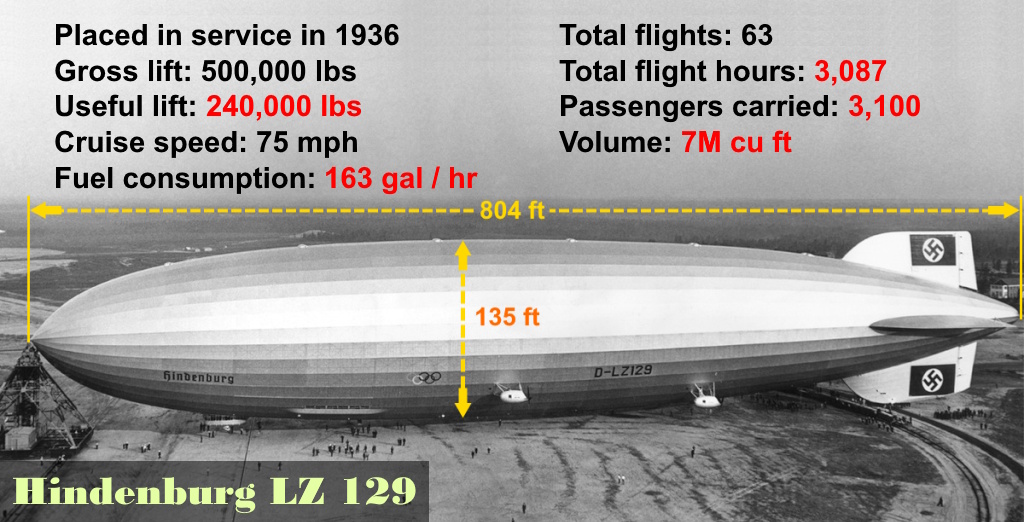
- LTA-1 represents the fuel efficiency of the airship Hindenburg if she were upgraded with modern diesel engine technology, constant speed propellers, and carrying cargo at the same 15 knot or 17 mph cruise velocity as a large container ship like the OOCL Hong Kong.
- LTA-2 represents the Hindenburg with the same tech as LTA-1 but traveling at 25 mph, which is the average velocity of a modern freight train in North America.
- LTA-3 also represents the Hindenburg with the same tech as LTA-1 but traveling at 35 mph, which is the average velocity for Class 8 trucking in North America.
LTA’s superior fuel efficiency, as displayed in the column chart, is the result of buoyancy nullifying the effects of gravity, rendering the airship and cargo virtually weightless.
We refer to this concept as “Weightless Cargo.”
With LTA, there are no grades!
Taking LTA’s fuel economy to an even higher level is the concept of “Direct Path Access,” which is the inherent ability to travel in a straight line from departure to destination.
No other form of transportation shares the benefits of these two concepts.
LTA’s positive impact on global fuel consumption will not be realized until it is a commonly accepted and utilized technology.
Quantifying Wasteful Fuel Consumption
A technology’s ability to perform the same work as other transportation modes while consuming less fuel is an impressive gain, but not the only factor to consider.
As previously stated, LTA has the advantage of a concept we call “Direct Path Access.”
Direct path access eliminates wasteful trekking.
This means LTA uses a shorter distance to perform the same work and thus consumes less fuel and time.
The fuel consumption chart below attempts to quantify the magnitude of the impact of this concept.
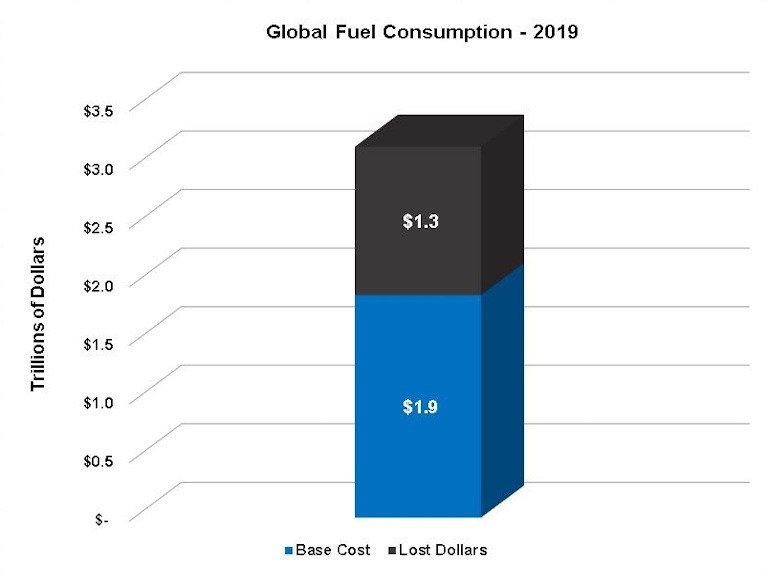
As an example, in 2019 the US government’s Energy Information Administration (EIA) estimated global fuel consumption to be 1.2 trillion gallons.
At an average price of $2.64 per gallon in 2019, that equates to approximately $3.2 trillion spent on fuel in just one year!
If we assume 40% of the fuel consumed to be the result of following the indirect path provided by the ground-based transportation infrastructure, then that equates to $1.3 trillion or 480 billion gallons of wasted fuel.
In support of this reality, consider your own driving experiences. While traveling to any destination, you must take an indirect path and will experience multiple turns, stops, starts, deceleration due to congestion, merging traffic, etc., followed by periods of acceleration and changes in grade. In addition, this is the most inefficient way to operate a motor vehicle equipped with an internal combustion engine (ICE).
It’s a well-documented fact that more than 50% of the energy contained in every gallon of fuel is consumed by the ICE itself long before any power reaches the wheels of the vehicle.
The inefficiencies of the ground-based transportation system coupled with the internal combustion engine are mind-boggling.
Making matters worse, 3 of the modes used to transport cargo today utilize ICE technology:
- Trucking
- Rail
- Vessel
ICE Plus Infrastructure Inefficiencies
Taking the previous discussion a step further, the chart below displays the estimated fuel consumption when both the ICE’s inefficiencies and the inefficiencies of the ground-based transportation infrastructure are considered collectively.
As displayed, out of the $3.2 trillion spent globally for fuel in 2019, only an estimated $500 billion can be considered the base fuel consumption.
Stated another way, when considered collectively, the inefficiencies of both ICE technology and the ground-based transportation system account for 85% of global fuel consumption. Meaning only 15% is required for the actual work of moving people and cargo.
By utilizing direct path access and weightless cargo, LTA will prove itself the most efficient transportation technology in the 21st century, beating out all other modes in both time and fuel economy while simultaneously creating a new transportation paradigm.

Ground Transportation Infrastructure Cost
In addition to its fuel and time efficiencies, LTA is not shackled to costly ground infrastructure, which is characteristic of all other forms of transportation.
That means that unlike the Class I railroad companies in the US, who spend $20 billion annually maintaining over 100,000 miles of track and 104,000 trestles, or the state and local entities, who spend $250 billion annually maintaining over 4 million miles of roads and highways, LTA will allow these monies to be used more productively by the entrepreneurs and taxpayers of the world.

Square-Cube Law Advantage
LTA possesses yet another advantage not shared by today’s transportation technologies.
It’s referred to as the “Square-Cube Law,” which is a mathematical principle that describes how, as an object increases in length or diameter, its volume increases at an even greater rate.
In simple terms, as you make small increases to LTA’s length or diameter, its volume increases exponentially.
The net effect of this is that LTA becomes cheaper to build per cubic foot of volume, and its payload capacity, and therefore profitability, increases at a faster rate than its build cost.
Additionally, its lift-to-drag ratio, a ratio used in the aircraft industry to express a design’s efficiency, also increases dramatically (the greater the value, the better).
To provide a comparison, a modern Boeing 787 Dreamliner has a lift-to-drag ratio of 21, whereas the Hindenburg’s lift-to-drag ratio was 43.
There are many reasons for the Hindenburg’s advantage, one of which is its ellipsoidal shape, which is far more aerodynamic than the tubular form used by today’s fixed-wing aircraft.
More Resources
For a deeper dive into the concepts discussed on this page, we recommend viewing the following presentations on our “Pitch Deck” page:
LTA's Historical Stats
- German airship program duration: 1889 – 1940
- The Germans were the first to master controlled flight
- All German Zeppelins were equipped with hydrogen as the lift gas
- More than 120 German Zeppelins were built
- 80 German Zeppelins were used in WWI to fight England and their allies
- First humans to travel by air were aboard an airship
- First humans to traverse continents and oceans were aboard a Zeppelin
- First humans to travel around the world were aboard a Zeppelin
- First aerial bombing of a population was carried out by a Zeppelin
- Until the demise of the Hindenburg in 1937, the Germans had enjoyed a perfect passenger safety record spanning 40 years of their operations
- To date, the Germans have the only successful airship program in history
- It took fixed-wing aircraft (airplane) 20 additional years to equal the Zeppelin’s accomplishments
Graf Zeppelin LZ-127 Stats
- Considered the most successful Zeppelin due to its 9 years of service
- Service period: 1928 – 1937
- 34,000 passengers safely transported
- 590 successful flights
- 17,000 flight hours
- October 1928 – first successful crossing of the Atlantic
- August 26, 1929 – successfully completed its Around-the-World Expedition
- Expedition total duration: 21 days
- Expedition flight hours: 288 (12 days)
- Expedition distance traveled: 21,250 miles
- Expedition passengers and crew: 60 men and 1 woman
- Expedition average speed: 71mph
- July 1931 – successfully completed its Polar Flight to the North Pole
Hindenburg LZ-129 Stats
- The largest aircraft ever built
- Considered one of the most technologically advanced airships
- Service period: 1936 – 1937
- Passenger accommodations: 50 – 75
- 3,100 passengers safely transported
- 63 successful flights
- 3,100 flight hours
- Average cruise speed: 75mph
- Top speed: 85mph
- Fuel consumption: 163 gallons of diesel fuel per hour in total
- Gross lift: 511,000 lbs
- Useful lift: 240,000 lbs
- Destroyed by fire May 6, 1937