Return on investment
Lighter-than-Air technology will prove itself the most efficient and profitable form of transportation in the 21st century, beating out all other modes in time and fuel economy, and by providing an unparalleled passenger experience.
Proven Technology - New Logistics
Because Lighter-than-Air technology (LTA) hasn’t been used for nearly 90 years, there is no current business model we can look to for guidance on successful marketing, sales, and use of the technology.
Essentially, this is uncharted territory and the beginning of a new entrepreneurial journey.
In considering the larger picture, we are not just talking about the re-emergence of a once successful technology, but the revolutionizing of the global transportation industry as we know it today and the birth of a new branch of logistics.
Imagine being able to transport finished goods directly from the manufacturer to the reseller with virtually no handling costs in the middle. This would be a game changer for the transportation industry, improving delivery efficiency with LTA’s superior time and fuel economy.
Today, all contemporary forms of transportation are enslaved to a costly and inefficient ground infrastructure that is trapped in an endless cycle of build, saturate, and build again. For example, within the US alone, state and local governments spend on average $250 billion annually maintaining and upgrading their 4.1 million miles of roads and highways. Additionally, the 7 Class I railroad companies in the US spend on average $20 billion annually maintaining and upgrading more than 100,000 miles of track and over 104,000 bridges. Compounding this issue is the need, within the US trucking industry, for at least 80,000 additional drivers to meet current shipping demands. This equates to nearly that many additional trucks on our roads and highways.
It’s this enslavement that requires the shipping industry to utilize common routes spotted with Distribution Centers (DCs), where bulk products are divided into smaller shipments for transport to multiple downstream DCs. This requires the same products to be handled multiple times before reaching their intended destination. This maze of indirect routes and distribution centers are a requirement when utilizing a ground-based transportation system for the delivery process.
Lighter-than-Air technology has the capability to deliver directly from the manufacturer to the customer using the only free and open transportation infrastructure, the Earth’s atmosphere, which provides point-to-point, unobstructed access to all global destinations.
The Ton-Mile
Before we dive into our cost and profit projections, we need to review some terms.
When it comes to transporting cargo, the Ton-Mile is the unit of choice for the cargo industry.
As its name suggests, it is equivalent to one ton of freight transported one mile. Or, in the case of 3,000 ton-miles, it could represent 3 tons transported 1000 miles, 30 tons transported 100 miles, or any variation of weight and distance the combination of which would equal 3,000. It’s simply the weight of the freight in tons multiplied by the distance in miles that the freight is transported.
The Revenue Ton-Mile builds on the principle of the ton-mile. Usually reported by railroad companies in their annual R1 reports, it represents how much revenue a company makes per volume of freight transported.
As an example, if a freight company routinely charges $6,000 to transport 10 tons 300 miles, then the revenue ton-mile would be calculated as $6,000 ÷ 3,000 ton-miles, or $2 per ton-mile.
There are many additional factors that come into play with the revenue ton-mile, such as including deadhead miles, which result from transporting empty railcars and intermodal containers back to their points of origin so they can be used again.
All freight companies have a minimum they must charge per ton-mile to break even and remain in business.
The Ton-Mile per Gallon metric also builds on the ton-mile principle and is used to measure and compare the fuel efficiencies of different transportation technologies.
As an example, if 600 gallons of fuel were consumed transporting 10 tons of freight 300 miles, then the ton-miles per gallon would be calculated as 3,000 ton-miles ÷ 600 gallons, or 5 ton-miles / gallon.
The railroad industry has often used this metric to express its superior fuel economy over the other transportation technologies of today.
For example, the Class I railroad company BNSF boasts they can achieve 480 ton-miles per gallon, meaning they can transport 480 tons 1 mile on 1 gallon of fuel. However, like the fuel economy values advertised on new vehicles, this value does not reflect actual fuel economy in real-world conditions.
ROI Projections - Airship Only
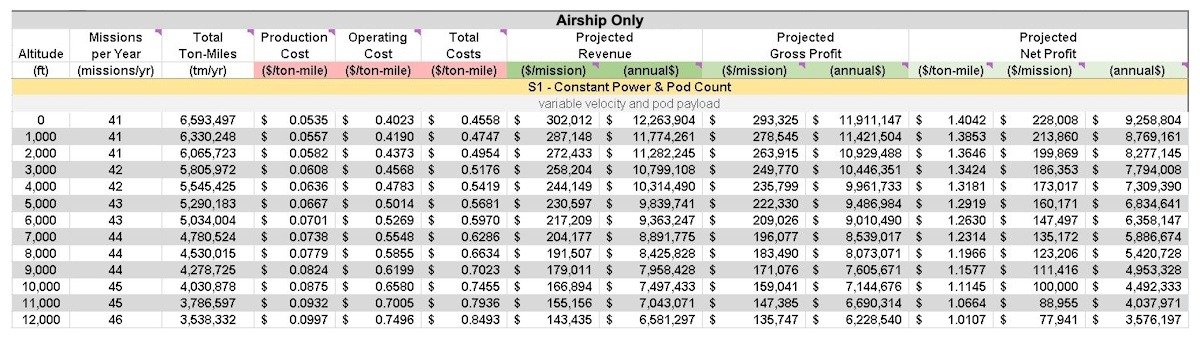
In the “Airship Only” ROI projections displayed above, we used an operational period of 3,120 hours per year out of the available 8,760 hours for our calculations. This reflects 6 months of operations with a 5-day workweek at 24 hours per day. We chose this metric to present conservative projections even though year-round operations will be carried out.
Next, we calculated our costs and profit on a per mission basis. For the above calculations, a mission is a round trip of 6,000 miles with the delivery of payload at the end of the first 3,000 miles. The airship’s payload is approximately 50 tons and its velocity 75 mph.
The “Missions per Year” column displays the number of missions that can be completed in the 3,120-hour cycle mentioned above.
The “Total Ton-Miles” column displays the total ton-miles completed in the 3,120-hour cycle.
“Production Cost” represents the airship’s estimated build cost annualized over a 15-year period. LTA will have a longer service life than fixed or rotor-wing aircraft due to several factors such as slower operating velocity, no landing requirement, lower operational altitude, no requirement for cabin pressurization, and overall higher safety factor.
“Operating Cost” represents costs such as fuel, payroll, insurance, rent, utilities, etc.
We calculated our “Projected Revenue” on both a per mission and annual basis with $1.86 as our revenue per ton-mile metric. The average revenue per ton-mile for the US trucking industry in 2020 was $2.34, and for the 7 Class I railroad companies it was $1.66. We use the $1.86 value because it reflects the rail revenue adjusted for the inclusion of trucking. With rail, trucking is used for both the first and last mile of the delivery process; therefore, its average revenue per ton-mile must be increased to include the additional cost.
Generally, air is the most expensive method of shipping. But it’s interesting to note, according to the Bureau of Transportation Statistics, that its average revenue per ton-mile for 2020 was only $2.06 versus trucking’s $2.34. The trucking industry can charge a higher rate because they are often forced to sit idle for 8 to 10 hours waiting for loading or unloading, which drives up operating costs, and because they’re the only transportation mode that has access to the customer’s front door.
Due to its faster delivery capability, it’s only reasonable that LTA could charge at least the same rates as the trucking industry.
“Projected Gross Profit” represents projected revenue minus production cost.
“Projected Net Profit” represents projected gross profit minus operating costs.
You will notice that the ton-mile and profit values in the projections diminish with the increase in altitude. This is due to decreasing air density resulting in decreased lift capability which affects all modern aircraft. The early Germans would operate their airships at an altitude of approximately 1,000 feet above ground level to take advantage of the aerial view and the additional lift capability. This resulted in most of their flight operations being below 6,000 feet as at least 80% of the world’s landmass is below 5,000 feet. Therefore, there is no reason to operate at high altitudes unless the point of origination or destination requires it.
The Net Profit Margin for our projections is in the 75% range. There are several reasons this is possible:
- LTA has a low operational cost from both a fuel consumption and maintenance standpoint.
- Our design requires minimal crew and ground support staff.
- LTA requires virtually no ground infrastructure.
To see how LTA performs against today’s transportation technologies, see our “LTA Efficiency Stats” webpage.
ROI Projections - 10-Unit Pod Train
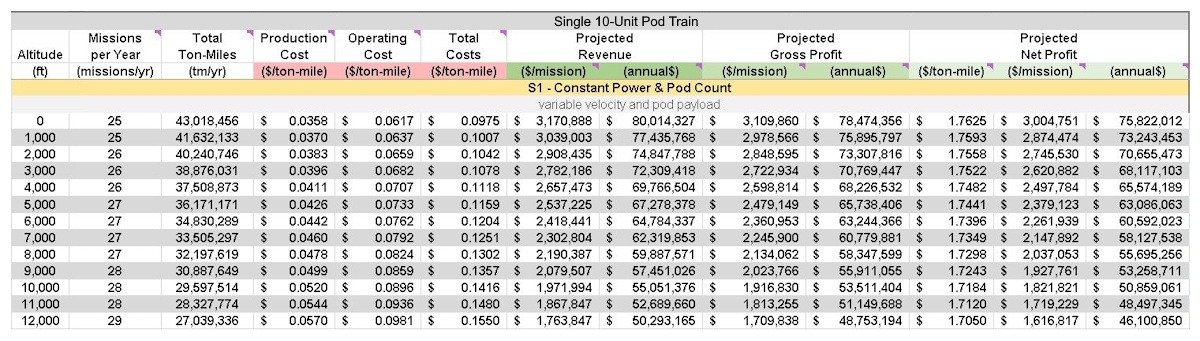
In the “Single Pod Train” ROI projections displayed above, a single 10-unit pod train traveling at a velocity of 50 mph is utilized.
The same operational period and mission length as described in the airship projections are also used for these calculations.
The pod train is a new concept where pods are used instead of the airship to carry the payload, much like railcars in our modern railroad system.
This allows LTA to be more flexible and scalable while also improving efficiency and profitability as is displayed by our projections.
The pod train concept is more fuel efficient due to decreased drag on the pods which is a result of them slipstreaming the airship.
This equates to a lower operating cost which yields a higher Net Profit Margin compared to using only the airship for payload transport.
For more information on the pod train concept, see our video presentation entitled “New Design Flight Ops”, available on our “Pitch Deck” page.
Potential Investors
Investors, as many of you already know, with any endeavor, projections are rarely accurate.
They generally serve as a futuristic goal and represent what a business hopes to achieve. As previously mentioned, there is no current business model available for review with respect to this technology.
However, we took great care in performing our research and calculations and are confident that the overall picture of profitability that we present is a conservative one.
Additionally, our projections are for only 1 airship or pod train. Increasing that number serves to dilute the back-office costs and increase profitability.
Conclusion
The ROI projections provided in the sections above represent part of a much larger picture.
Lighter-than-Air technology has many inherent advantages not shared by other forms of transportation, including:
- Weightless Cargo
- Direct Path Access
Weightless cargo: because buoyancy cancels the effects of gravity on the airship and its payload, fuel isn’t needlessly consumed in the struggle with gravity on the grade. With LTA, there are no grades!
Direct path access provides LTA with a point-to-point advantage, allowing it to travel in a straight line from departure to destination. No other form of transportation has this capability.
The significance of the fuel and time savings resulting from these two advantages cannot be overstated.
We are more than confident Lighter-than-Air technology will prove itself the most efficient and profitable form of transportation in the 21st century, beating out all other modes in time and fuel economy and by providing an unparalleled passenger experience.
For more information on this topic, see our video presentation entitled “Profitability”, available on our “Pitch Deck” page.